In this post, I discussed card counting the Buster Blackjack (BBJ) side bet in the six-deck case. The player wins the BBJ side bet if the dealer busts. The payout is based on the number of cards in the dealer’s busted hand, with a top payout for an 8+ card dealer busted hand. There are at least eight different pay tables offered with BBJ. I developed card counting systems for two distinct groups of these pay tables. I found that BBJ has moderate vulnerability in the six-deck case for one group of pay tables, but low vulnerability for the rest. This article covers BBJ as a side bet for the two-deck game. I will digress at the end of this post into an obscure issue called the “cut card effect” that impacts the house edge for BBJ if a cut card is used. In my opinion, this effect is the most interesting feature of the analysis of BBJ.
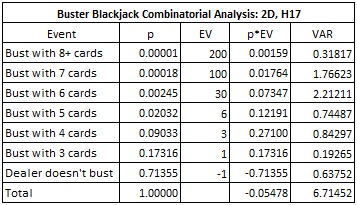
The most common pay table for BBJ in both the six-deck game and two-deck game is (1,3,6,30,100,200) for busting with 3, 4, 5, 6, 7, 8+ cards respectively. Here is the combinatorial analysis for this pay table in the two-deck case:
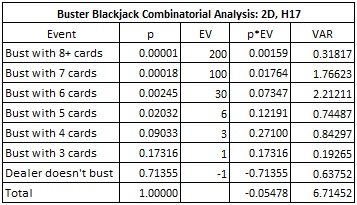
In particular,
- The house edge is 5.478%.
- The standard deviation is 2.591.
- The hit frequency is 28.645%.
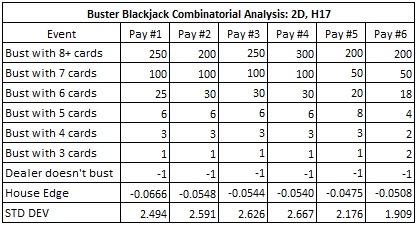
Here is a summary of the combinatorial analysis for six different pay tables for BBJ in the two-deck case. The combinatorial analysis given above corresponds to pay table #2 in the following.
The card counting system (system #2) I developed to use against the group of pay tables #1, #2, #3, #4, #5, has the following tags:
- 7, 8, 9, T = +1
- 4, 5, 6 = 0
- A, 3 = -2
- 2 = -3
Intuitively, the counter is looking for situations when hands are likely to require a large number of cards to complete. The cards A, 2, 3 often lead to multi-card hands, whereas 7, 8, 9, T are cards that lead to hands that typically finish in two or three cards. Dealer hands may bust or not, but that isn’t what the counter is going after. He just wants situations that are likely to produce multi-card dealer hands.
To analyze system #2, I simulated one hundred million (100,000,000) two-deck shoes, with the cut card placed at 75 cards (29 cards from the end). The following table summarizes the results of this simulation:
These numbers indicate that BBJ has a high vulnerability to advantage play in the two-deck case. If the AP uses system #2 against BBJ with pay table #2, on a fast heads-up game where he gets 200 rounds per hour, and the AP makes a $100 wager on BBJ whenever he has the edge, then the AP can earn $246 per hour on the BBJ side bet. The AP using system #2 will have an average edge over the house of 7.30% and will make the bet on 16.83% of his hands.
The other group of pay tables are represented by pay table #6 above. These pay tables pay 2, 2 and 4 respectively for busts with 3, 4 or 5 cards. Because these pay tables do not quickly increase in pay for busting with 4 or 5 cards, they are not vulnerable to a card counting strategy based on multi-card hands. The card counting system (system #3) developed for these pay tables highlights this lack of correlation.
Here are the tags for system #3:
- 7 = +2
- A, 5, 8, 9 = +1
- 4, T = 0
- 6 = -1
- 3 = -2
- 2 = -3
The following table gives card counting statistics for the pay tables given above.
- For pay tables #1, #2, #3, #4 and #5, I used system #2 with tags (-2, -3,-2,0,0,0,1,1,1,1).
- For pay table #6, I used system #3 with tags (1,-3,-2,0,1,-1,2,1,1,0).

These results show that BBJ has a high vulnerability to card counting for each of the pay tables #1, #2, #3, #4 and #5, with pay table #4 having the greatest vulnerability. On the other hand, as in the six-deck case, pay table #6 shows a low vulnerability to advantage play.
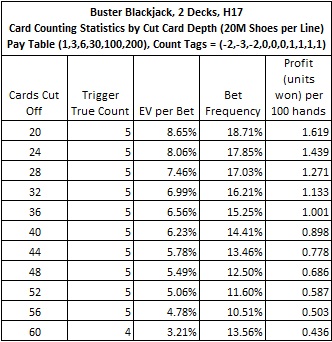
The most common defense to card counting is to change the location of the cut card so that fewer rounds are dealt between shuffles. The following table gives card counting statistics for pay table #2 with cut card placements from 20 cards to 60 cards. This table shows that cut card placement has a strong effect on game protection. However, decreasing penetration means that the dealer will be shuffling more often. The time/motion equation almost always favors less time shuffling and more time dealing. The only situation where I would recommend using decreased penetration to protect the game is when there is suspected advantage play taking place and no other action is possible against the AP.
My single recommendation for protecting BBJ in the two-deck case is the same as my recommendation for the six-deck shoe game:
- In a two-deck game, only offer versions of BBJ with a pay table that pays 2-to-1 when the dealer busts with 3 or 4 cards.
Digression: The Cut Card Effect
There is another topic I want to discuss for the two-deck shoe. This is an obscure phenomenon that is observed in ordinary blackjack that reared its head in this analysis. The “cut card effect” occurs in blackjack whenever a cut card is used to trigger a shuffle. The cut card effect does not occur if a fixed number of hands are dealt between shuffles. The point is that using a cut card actually moves the house edge towards the house side compared to the house edge that occurs for dealing a fixed number of hands from the shoe.
First consider what happens if the count is positive when the cut card is reached. Then a lot of low cards (2,3,4,5,6) have come out so that the previous hands have used more cards per hand to complete. Fewer hands in total are played by the time the cut card comes out than in a neutral deck. So, when the count is positive, the player gets to play fewer hands before the shoe is shuffled.
Conversely if the count is negative when the cut card is reached, then a lot of ten-valued cards have come out. But these cards create hands that use fewer cards per hand to complete. This means that more hands will be played by the time the cut card comes out than in a neutral deck. So, when the count is negative, the player gets to play more hands before the shoe is shuffled.
In summary, if low cards come out, so that the count is positive, then fewer hands are played between shuffles. If high cards come out, so that the count is negative, then more hands are played between shuffles. More hands are played in negative counts, when the house edge is increased. Fewer hands are played in positive counts, when the edge moves towards the player. This moves the edge towards the house side. This change in edge affects every player at the game, not just the card counters.
What is surprising is that the cut card effect has a significant impact on the house advantage for the BBJ side bet as well. But for BBJ, the use of a cut card moves the edge in the opposite direction, towards the player.
First consider what happens if the count is positive when the cut card is reached for the BBJ side bet. In this case, a lot of high cards (7, 8, 9, T) have come out (see system #2) so that the previous hands have used fewer cards per hand to complete. More hands in total are played by the time the cut card comes out than in a neutral deck. So, when the count is positive, the player gets to play more hands.
Conversely if the count is negative when the cut card is reached, then a lot of low cards (A, 2, 3) have come out. But low cards create hands that use more cards per hand to complete. This means that fewer hands will be played by the time the cut card comes out than in a neutral deck. So, when the count is negative, the player gets to play fewer hands.
For the BBJ side bet, if high cards come out, so that the count is positive, then more hands are played between shuffles. If low cards come out, so that the count is negative, then fewer hands are played between shuffles. More hands are played in positive counts, when the edge moves towards the player, than in negative counts, when the edge moves towards the house. The overall effect of this is to move the edge toward the player side. This change in edge affects every player at the game, not just the card counters.
Recall that the house edge for the two-deck version of BBJ, using pay table #2, is 5.478%. If a fixed number of rounds are dealt between shuffles, then this value represents the overall house edge. For example, if one round is dealt between shuffles (cut card at 0 cards), then the house edge for every hand is exactly 5.478%.
The following table gives the house edge for various cut card placements from 0 cards to 80 cards for the two-deck version of BBJ using pay table #2. Each row was determined by a simulation of three hundred million (300,000,000) two-deck shoes with the indicated cut card placement.
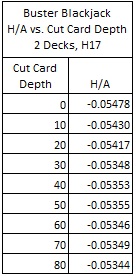
Note that when the cut card is placed at 80 cards, the house edge for BBJ is approximately 5.344%. This percentage represents a movement in the house edge for BBJ towards the player side of about 0.13%.
The data for these simulations is best understood when it is graphed:
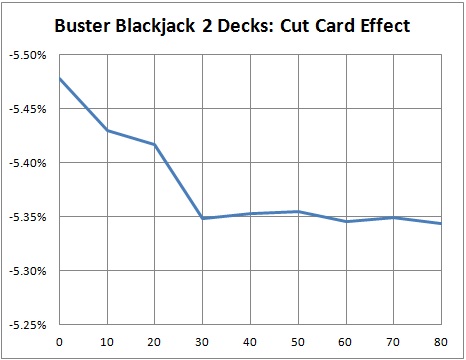
The impact of using a cut card for card counting BBJ is that it helps the AP, whereas for ordinary blackjack card counting, the use of a cut card hurts the AP. The edge has not moved far enough for this effect to significantly impact the vulnerability of BBJ to advantage play. But for those of us who abide in advantage play nerd-land, this is the most interesting part of the analysis.


