The opening scene in the play “Rosencrantz and Guildenstern Are Dead” shows the main characters involved in an experiment in probability theory. Rosencrantz and Guildenstern are on a mountain path when Guildenstern sees a coin on the trail. He picks up the coin, and flips it, then flips it again and again... What follows is unlikely; heads comes up 157 times in a row. Here is the concluding dialogue from that scene:
 GUILDENSTERN: It must be the law of diminishing returns. I feel the spell about to be broken. (He flips a coin high into the air, catches it, and looks at it. He shakes his head.) Well, an even chance.
ROSENCRANTZ: Seventy-Eight in a row. A new record, I imagine.
GUILDENSTERN: Is that what you imagine? A new record?
ROSENCRANTZ: Well.
GUILDENSTERN: No questions, not a flicker of doubt?
ROSENCRANTZ: I could be wrong.
GUILDENSTERN: No fear?
ROSENCRANTZ: Fear?
GUILDENSTERN: (He hurls a coin at Rosencrantz.) Fear!
ROSENCRANTZ: (looking at the coin) Seventy-Nine.
GUILDENSTERN: I think I have it. Time has stopped dead. The single experience of one coin being spun once is being repeated …
ROSENCRANTZ: Hundred and fifty-six.
GUILDENSTERN: … a hundred and fifty-six times! On the whole, doubtful. Or, a spectacular indication of the principle that each individual coin spun individually is as likely to come down heads as tails, and therefore should cause no surprise each individual time it does.
ROSENCRANTZ: Heads. I’ve never seen anything like it.
GUILDENSTERN: We have been spinning coins together since … I don’t know when. And in all that time, if it is all that time, one hundred and fifty-seven coins, spun consecutively, have come down heads one hundred and fifty-seven consecutive times, and
all you can do is play with your food!
Getting heads 157 times in a row is an event with a probability so small it can just barely be determined by an Excel spreadsheet computation:
P(157 consecutive heads) ≈ 0.00000000000000000000000000000000000000000000000547382.

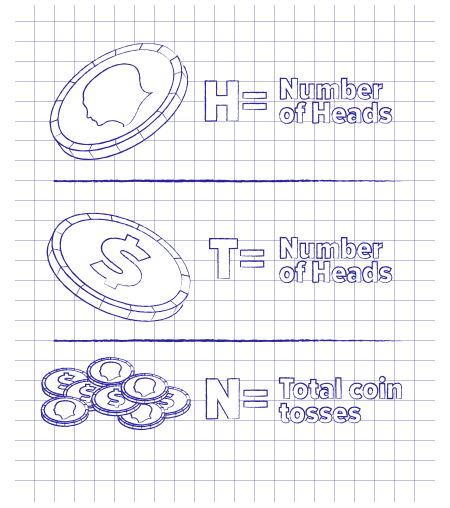
Let’s put the experience of these characters into the context of the “long run.” Suppose we are conducting an experiment tossing a coin over and over. Let’s count the number of times heads and tails each come up. We will need three counting variables for this. We let “H” denote the number of times that heads comes up, “T” will denote the number of times tails comes up, and “N” will denote the total number of times the coin has been tossed.
Many people mistakenly believe that “in the long run, the number of heads and tails balances out, so that they are roughly the same.” This is false; that is not what the “long run” says at all. The most common fallacious thinking about the long run is the belief that eventually we must have the number of heads equal to the number of tails, or H = T. Based on this belief, people wager more on heads when a lot of tails have appeared, or more on tails when a lot of heads have appeared, using the logic that the other variable has to catch up. That is not the law of averages. Unequivocally, this is not what “the long run” means. It is not a statement that things come out exactly right if enough rounds of the experiment are conducted. The “long run” simply means that the ratio of reality to theory gets closer and closer to 1 as the number of times we conduct the experiment gets large. To be precise in the case of the coin experiment, the probability of heads is 0.5. The number of times we expect heads to come up in N tosses is (0.5) × N. That’s theory. Reality is the variable H that counts the actual number of times heads came up. So, the “long run” says that the fraction:
H / [(0.5) × N]
gets closer and closer to 1 as N (the number of tosses) gets large. Suppose we are back in Tom Stoppard’s play, and heads has come up 157 times in a row. Then H = 157 and N = 157, so the fraction in question is:
157 / [(0.5) × 157] = 2.0000
That’s not very close to 1. Now what happens if the coin is tossed 2,000 more times and it reverts back to a normal 50-50 for those 2000 times, despite the beginning drama? Then after N = 2,157 tosses we have H = 1,000 + 157 = 1,157 and T = 1,000. The values of H and T have not gotten any closer together. So what about the long run? Now the fraction is:
1,157 / [(0.5) × 2,157] = 1.0728
We see that the initial issue with the coin is dwarfed by the steadiness of the events to follow. So, long term normal behavior overwhelms short-term aberrations. That’s the long run!
Let’s reset and run another example from scratch. In this case I am going to show you that the values of H and T can get further and further apart, but still have “the long run” work out right. Consider the following possible outcomes for tossing the coin:

And so on. As you can see, the values of H and T are getting further apart. After N = 20, the values of H and T differ by 2. After N = 200,000 these values differ by 10. Continuing this pattern we see that H and T are never equal to each other and that they continue to get further apart. Nevertheless, the fraction describing the long run gets closer and closer to 1. That is, the fraction H / N is getting closer and closer to 1 / 2, the theoretical probability of getting heads.n:
THE LONG RUN IS THE STATEMENT THAT:
This ratio gets closer to 1 as the number of times the experiment is conducted gets larger and larger. Having this fraction get close to 1 is not the same as having the numerator and denominator get close to each other in their values. That’s the tough mathematical point that it’s hard for many people to get. Because this is a ratio, it does not say anything about the exact values of the variables. Fractions can get closer and closer to a value, even as the numerator and denominator get further apart.
For example, the following series of fractions gets closer and closer to 1, even as the numerator gets further and further from the denominator:
11/10, 102/100, 1,003/1,000, 10,004/10,000, 100,005/100,000 …

The long run is not a mystery saying that things have to even out, that hot dealers must go cold, that red and black have to occur the same number of times in roulette, that slots are more likely to pay out if they haven’t hit in a while, that the player is due for a blackjack. There is no “evening out” implied by the long run. There is simply the slow march of fractions converging to the expected value of 1.
The purpose of the variance is to give a sense for how quickly the fractions get close to 1. In a low variance game, the ratio of reality to theory very quickly converges to 1. The higher the variance, the more rounds it takes for this fraction to settle down. Low variance corresponds to few short-term aberrations, in other words, very few large payouts. High variance corresponds to a greater frequency of short-term aberrations, in other words, large payouts are more common. The fractions are going to get closer and closer to 1, that’s the law (the so-called “Law of Large Numbers”). It’s the journey to “1” that gives the player the experience he wants.


